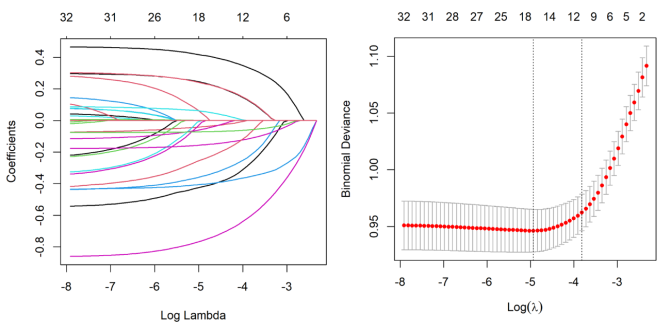
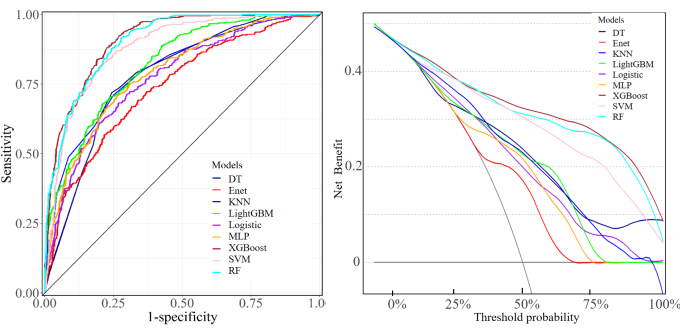
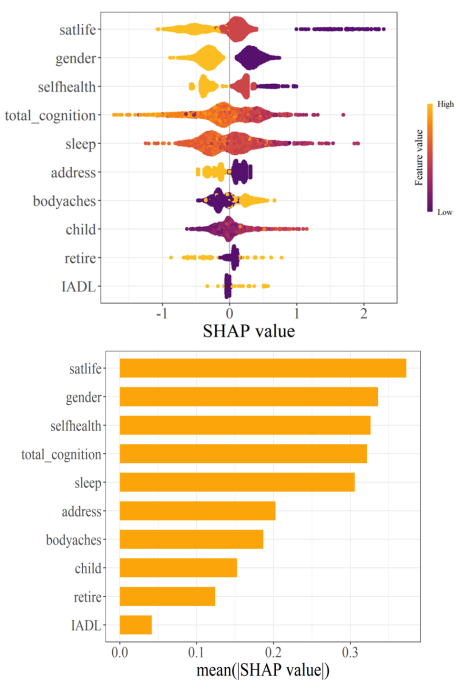
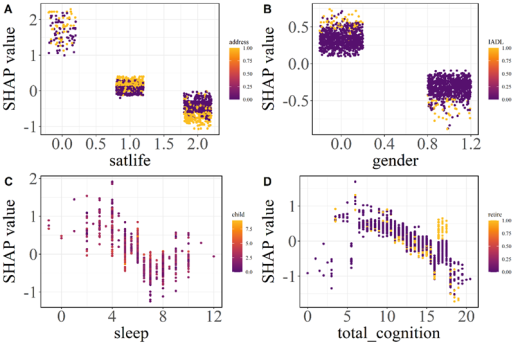
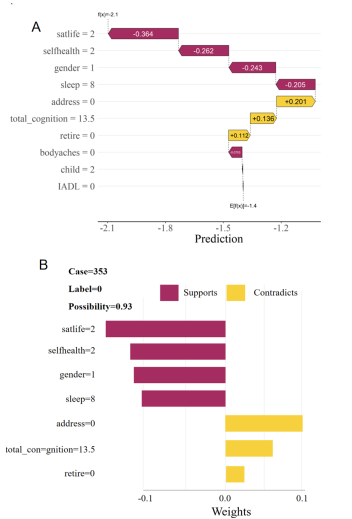
Objectives: The aim of this study was to construct depression prediction models based on machine learning algorithms, compared the performance of different machine learning models on depression risk prediction, and interpreted the model. Methods: A total of 2573 participants from the CHARLS database. LASSO and stepwise regression were used to screen for variables. The dataset is randomly divided into training set, validation set and test set according to 6:2:2. SMOTE resampling was used to balance the training set when fitted the model. Nine machine learning algorithms were used to construct the prediction model, inclpuding Decision Tree (DT), Random Forest (RF), Extreme Gradient Boosting (XGBoost), Light Gradient Boosting Machine (LightGBM), Elastic Network Regression (Enet), Support Vector Machine (SVM), Logistic Regression, Multilayer Perceptron (MLP), and K-Nearest Neighbor (KNN). The prediction ability of each machine learning classifier was evaluated on the test set according to the evaluation index, and the "optimal" model of this study was selected. Subsequently, SHapley Additive exPlanations (SHAP) and Local Interpretable Model-agnostic Explanations (LIME) were used to analyze the interpretability of the optimal model. Results: The XGBoost model predicted the best performance among the 9 models. Its AUC value reached 0.908 and the clinical net benefit is the highest. The Delong test showed that there was a significant difference between the ROC curves of XGBoost and the other models (P<0.05). The global interpretation based on SHAP showed that life satisfaction, self-rated health status, sleep duration, and cognitive score were inversely proportional to the SHAP value. Female, rural residents, body aches and pains in any area, non-retirement, and limited Instrumental Activities of Daily Living (IADL) have a positive effect on depression. The local interpretation diagram based on SHAP and LIME showed the personalized risk prediction of a single sample. Conclusions: Machine learning models are an effectively tool for predict the risk of depression. The use of SHapley Additive exPlanations and Local Interpretable Model-agnostic Explanations can maximize the clinical advantages of machine learning, which is helpful to predict or detect patients at high risk of depression as early as possible, and to take comprehensive evaluation and early prevention and treatment of depression.
| Published in | Science Discovery (Volume 13, Issue 2) |
| DOI | 10.11648/j.sd.20251302.12 |
| Page(s) | 25-32 |
| Creative Commons |
This is an Open Access article, distributed under the terms of the Creative Commons Attribution 4.0 International License (http://creativecommons.org/licenses/by/4.0/), which permits unrestricted use, distribution and reproduction in any medium or format, provided the original work is properly cited. |
| Copyright |
Copyright © The Author(s), 2025. Published by Science Publishing Group |
Machine Learning, Depression, Predictive Models, SHapley Additive exPlanations, Local Interpretable Model-agnostic Explanations
 检验。采用Delong检验来评估不同模型之间AUC值的差异。所有检验均为双侧检验,P<0.05为差异有统计学意义。
 特征 | 分组 | 抑郁(n=607) | 非抑郁(n=1966) | t/χ2 | P |
性别 | 女 | 359 (59.1) | 872 (44.4) | 40.65 | <0.001 |
男 | 248 (40.9) | 1094 (55.6) | |||
退休状况 | 否 | 542 (89.3) | 1603 (81.5) | 20.12 | <0.001 |
是 | 65 (10.7) | 363 (18.5) | |||
家庭住址 | 农村 | 412 (67.9) | 1100 (56.0) | 27.21 | <0.001 |
城镇 | 195 (32.1) | 866 (44.0) | |||
自评健康状况 | 差 | 91 (15.0) | 103 (5.24) | 13.05 | <0.001 |
一般 | 356 (58.6) | 887 (45.1) | |||
好 | 160 (26.4) | 976 (49.6) | |||
生活满意度 | 不满意 | 110 (18.1) | 62 (3.15) | 19.98 | <0.001 |
一般 | 350 (57.7) | 1098 (55.8) | |||
满意 | 147 (24.2) | 806 (41.0) | |||
身体疼痛 | 否 | 265 (43.7) | 1291 (65.7) | 93.99 | <0.001 |
是 | 342 (56.3) | 675 (34.3) | |||
BADL | 不受限 | 524 (86.3) | 1865 (94.9) | 50.91 | <0.001 |
受限 | 83 (13.7) | 101 (5.14) | |||
IADL | 不受限 | 533 (87.8) | 1879 (95.6) | 47.69 | <0.001 |
受限 | 74 (12.2) | 87 (4.43) | |||
睡眠时长 | 5.96±1.68 | 6.56 ±1.45 | 8.49 | <0.001 | |
认知评分 | 12.33±3.27 | 13.28±3.13 | 7.84 | <0.001 | |
子女数量 | 2.24±1.06 | 2.08 ±1.06 | -3.35 | <0.001 | |
经济支持 (千元) | 4.95±1.47 | 6.04±2.31 | 2.28 | 0.013 | |
注:BADL:基本日常生活活动;IADL:工具性日常生活活动; | |||||
模型 | AUC | 准确率 | 灵敏度 | 特异度 | 精确率 | F1 | Kappa |
Logistic | 0.773 | 0.701 | 0.684 | 0.718 | 0.708 | 0.696 | 0.402 |
Enet | 0.738 | 0.672 | 0.649 | 0.695 | 0.680 | 0.664 | 0.344 |
DT | 0.780 | 0.738 | 0.720 | 0.756 | 0.747 | 0.733 | 0.476 |
RF | 0.901 | 0.827 | 0.880 | 0.756 | 0.786 | 0.823 | 0.621 |
XGBoost | 0.908 | 0.810 | 0.898 | 0.740 | 0.818 | 0.838 | 0.654 |
SVM | 0.881 | 0.798 | 0.766 | 0.830 | 0.772 | 0.791 | 0.595 |
MLP | 0.788 | 0.714 | 0.634 | 0.794 | 0.755 | 0.689 | 0.427 |
LightGBM | 0.821 | 0.726 | 0.763 | 0.690 | 0.711 | 0.736 | 0.453 |
KNN | 0.801 | 0.730 | 0.710 | 0.751 | 0.740 | 0.725 | 0.461 |

| [1] | Smith K. Mental health: a world of depression [J]. Nature, 2014, 515(7526): 181. |
| [2] | Wang P S, Aguilar-Gaxiola S, Alonso J, et al. Use of mental health services for anxiety, mood, and substance disorders in 17 countries in the WHO world mental health surveys [J]. Lancet, 2007, 370(9590): 841-850. |
| [3] | Herrman H, Kieling C, McGorry P, et al. Reducing the global burden of depression: a Lancet-World Psychiatric Association Commission [J]. Lancet, 2019, 393(10189): e42-e43. |
| [4] | Alexopoulos G S. Depression in the elderly [J]. Lancet, 2005, 365(9475): 1961-1970. |
| [5] | McCarron R M, Shapiro B, Rawles J, et al. Depression [J]. Ann Intern Med, 2021, 174(5): ITC65-ITC80. |
| [6] | Mitchell A J, Vaze A, Rao S. Clinical diagnosis of depression in primary care: a meta-analysis [J]. Lancet, 2009, 374(9690): 609-619. |
| [7] | Hu C, Jiang Q, Yuan Y, et al. Depressive symptoms among the oldest-old in China: a study on rural-urban differences [J]. BMC Public Health, 2024, 24(1): 3604. |
| [8] | Loechner J, Starman K, Galuschka K, et al. Preventing depression in the offspring of parents with depression: A systematic review and meta-analysis of randomized controlled trials [J]. Clin Psychol Rev, 2018, 60: 1-14. |
| [9] | Bzdok D, Altman N, Krzywinski M. Statistics versus machine learning [J]. Nat Methods, 2018, 15(4): 233-234. |
| [10] | Grimmer J, Roberts M E, Stewart B M. Machine Learning for Social Science: An Agnostic Approach [J]. Annual review of political science, 2021, 24(1): 395-419. |
| [11] | Khan K, Ahmad W, Amin M N, et al. Compressive Strength Estimation of Steel-Fiber-Reinforced Concrete and Raw Material Interactions Using Advanced Algorithms [J]. Polymers, 2022, 14(15): 3065. |
| [12] | Ray S. A Quick Review of Machine Learning Algorithms [C], 2019. IEEE, 2019-01-01. |
| [13] | Li J J, Tong X. Statistical Hypothesis Testing versus Machine Learning Binary Classification: Distinctions and Guidelines [J]. Patterns (N Y), 2020, 1(7): 100115. |
| [14] | Chen Q, Zhang Y, Zhang M, et al. Application of Machine Learning Algorithms to Predict Acute Kidney Injury in Elderly Orthopedic Postoperative Patients [J]. Clin Interv Aging, 2022, 17: 317-330. |
| [15] | Lee Y, Ragguett R M, Mansur R B, et al. Applications of machine learning algorithms to predict therapeutic outcomes in depression: A meta-analysis and systematic review [J]. J Affect Disord, 2018, 241: 519-532. |
| [16] | Shatte A, Hutchinson D M, Teague S J. Machine learning in mental health: a scoping review of methods and applications [J]. Psychol Med, 2019, 49(9): 1426-1448. https://doi.org/10.1017/S0033291719000151 |
| [17] | Hatton C M, Paton L W, McMillan D, et al. Predicting persistent depressive symptoms in older adults: A machine learning approach to personalised mental healthcare [J]. J Affect Disord, 2019, 246: 857-860. |
| [18] | Radloff L S. The CES-D scale: A self-report depression scale for research in the general population [J]. Applied psychological measurement, 1977, 1(3): 385-401. |
| [19] | Zhang B, Fokkema M, Cuijpers P, et al. Measurement invariance of the Center for Epidemiological Studies Depression Scale (CES-D) among Chinese and Dutch elderly [J]. BMC Med Res Methodol, 2011, 11: 74. |
| [20] | Stephens A, Allardyce J, Weavers B, et al. Developing and validating a prediction model of adolescent major depressive disorder in the offspring of depressed parents [J]. J Child Psychol Psychiatry, 2023, 64(3): 367-375. |
| [21] | Wang Y, Li J, Bian W, et al. Latent classes of symptom trajectories among major depressive disorder patients in China [J]. J Affect Disord, 2024, 350: 746-754. |
| [22] | Wang K, Zhao Y, Nie J, et al. Higher HEI-2015 Score Is Associated with Reduced Risk of Depression: Result from NHANES 2005-2016 [J]. Nutrients, 2021, 13(2). |
| [23] | Xiao M, Yan C, Fu B, et al. Risk prediction for postpartum depression based on random forest [J]. Zhong Nan Da Xue Xue Bao Yi Xue Ban, 2020, 45(10): 1215-1222. |
| [24] | Gu S C, Zhou J, Yuan C X, et al. Personalized prediction of depression in patients with newly diagnosed Parkinson's disease: A prospective cohort study [J]. J Affect Disord, 2020, 268: 118-126. |
| [25] | Choi J, Choi J, Choi W J. Predicting Depression Among Community Residing Older Adults: A Use of Machine Learning Approch [J]. Stud Health Technol Inform, 2018, 250: 265. |
| [26] | Lin S, Wu Y, Fang Y. A hybrid machine learning model of depression estimation in home-based older adults: a 7-year follow-up study [J]. BMC Psychiatry, 2022, 22(1): 816. |
| [27] | Shin D, Lee K J, Adeluwa T, et al. Machine Learning-Based Predictive Modeling of Postpartum Depression [J]. J Clin Med, 2020, 9(9). |
| [28] | Abdoli N, Salari N, Darvishi N, et al. The global prevalence of major depressive disorder (MDD) among the elderly: A systematic review and meta-analysis [J]. Neurosci Biobehav Rev, 2022, 132: 1067-1073. |
| [29] | Ma H, Zhao M, Liu Y, et al. Network analysis of depression and anxiety symptoms and their associations with life satisfaction among Chinese hypertensive older adults: a cross-sectional study [J]. Front Public Health, 2024, 12: 1370359. |
| [30] | Kim H R, Kim S M, Hong J S, et al. Character strengths as protective factors against depression and suicidality among male and female employees [J]. BMC Public Health, 2018, 18(1): 1084. |
| [31] | Labonté B, Engmann O, Purushothaman I, et al. Sex-specific transcriptional signatures in human depression [J]. Nat Med, 2017, 23(9): 1102-1111. |
| [32] | Plaisier I, de Bruijn J G, de Graaf R, et al. The contribution of working conditions and social support to the onset of depressive and anxiety disorders among male and female employees [J]. Soc Sci Med, 2007, 64(2): 401-410. |
| [33] | Ferrari A J, Somerville A J, Baxter A J, et al. Global variation in the prevalence and incidence of major depressive disorder: a systematic review of the epidemiological literature [J]. Psychol Med, 2013, 43(3): 471-481. |
| [34] | Garde K. Depression--gender differences [J]. Ugeskr Laeger, 2007, 169(25): 2422-2425. |
| [35] | Albert P R. Why is depression more prevalent in women? [J]. J Psychiatry Neurosci, 2015, 40(4): 219-221. |
| [36] | Su Q, Fan L. Impact of caregiving on mental, self-rated, and physical health: evidence from the China health and retirement longitudinal study [J]. Qual Life Res, 2024, 33(7): 1-10. |
| [37] | Zhao H, Ma Q, Xie M, et al. Self-rated health as a predictor of hospitalizations in patients with bipolar disorder or major depressive disorder: A prospective cohort study of the UK Biobank [J]. J Affect Disord, 2023, 331: 200-206. |
| [38] | Ambresin G, Chondros P, Dowrick C, et al. Self-rated health and long-term prognosis of depression [J]. Ann Fam Med, 2014, 12(1): 57-65. |
| [39] | Maier A, Riedel-Heller S G, Pabst A, et al. Risk factors and protective factors of depression in older people 65+. A systematic review [J]. PLoS One, 2021, 16(5): e251326. |
| [40] | 安适, 袁娟, 陈涛, 等. 自评健康在老年人自理能力和抑郁症状之间的中介效应 [J]. 护理学报, 2022, 29(20): 55-59. |
| [41] | Zhang Y, Wang S, Hermann A, et al. Development and validation of a machine learning algorithm for predicting the risk of postpartum depression among pregnant women [J]. J Affect Disord, 2021, 279: 1-8. |
| [42] | Knight M J, Baune B T. Cognitive dysfunction in major depressive disorder [J]. Curr Opin Psychiatry, 2018, 31(1): 26-31. |
| [43] | Shimada H, Park H, Makizako H, et al. Depressive symptoms and cognitive performance in older adults [J]. J Psychiatr Res, 2014, 57: 149-156. |
| [44] | Zhai L, Zhang H, Zhang D. Sleep duration and depression among adults: a meta-analysis of prospective studies [J]. Depress Anxiety, 2015, 32(9): 664-670. |
| [45] | Firth-Cozens J. Individual and organizational predictors of depression in general practitioners [J]. Br J Gen Pract, 1998, 48(435): 1647-1651. |
| [46] | 史可为, 吴亚飞, 方亚. 临床预测模型的可解释性及应用进展 [J]. 现代预防医学, 2023, 50(06): 1122-1127. |
| [47] | Alabi R O, Elmusrati M, Leivo I, et al. Machine learning explainability in nasopharyngeal cancer survival using LIME and SHAP [J]. Sci Rep, 2023, 13(1): 8984. |
APA Style
Wang, J., Cui, M., Deng, M., Fan, Y., Ping, Z. (2025). Construction of Depression Prediction Model Based on Machine Learning and Its Interpretability. Science Discovery, 13(2), 25-32. https://doi.org/10.11648/j.sd.20251302.12
ACS Style
Wang, J.; Cui, M.; Deng, M.; Fan, Y.; Ping, Z. Construction of Depression Prediction Model Based on Machine Learning and Its Interpretability. Sci. Discov. 2025, 13(2), 25-32. doi: 10.11648/j.sd.20251302.12
AMA Style
Wang J, Cui M, Deng M, Fan Y, Ping Z. Construction of Depression Prediction Model Based on Machine Learning and Its Interpretability. Sci Discov. 2025;13(2):25-32. doi: 10.11648/j.sd.20251302.12
@article{10.11648/j.sd.20251302.12,
  author = {Juan Wang and Man Cui and Miao Deng and Yanshuai Fan and Zhiguang Ping},
  title = {Construction of Depression Prediction Model Based on Machine Learning and Its Interpretability
},
  journal = {Science Discovery},
  volume = {13},
  number = {2},
  pages = {25-32},
  doi = {10.11648/j.sd.20251302.12},
  url = {https://doi.org/10.11648/j.sd.20251302.12},
  eprint = {https://article.sciencepublishinggroup.com/pdf/10.11648.j.sd.20251302.12},
  abstract = {Objectives: The aim of this study was to construct depression prediction models based on machine learning algorithms, compared the performance of different machine learning models on depression risk prediction, and interpreted the model. Methods: A total of 2573 participants from the CHARLS database. LASSO and stepwise regression were used to screen for variables. The dataset is randomly divided into training set, validation set and test set according to 6:2:2. SMOTE resampling was used to balance the training set when fitted the model. Nine machine learning algorithms were used to construct the prediction model, inclpuding Decision Tree (DT), Random Forest (RF), Extreme Gradient Boosting (XGBoost), Light Gradient Boosting Machine (LightGBM), Elastic Network Regression (Enet), Support Vector Machine (SVM), Logistic Regression, Multilayer Perceptron (MLP), and K-Nearest Neighbor (KNN). The prediction ability of each machine learning classifier was evaluated on the test set according to the evaluation index, and the "optimal" model of this study was selected. Subsequently, SHapley Additive exPlanations (SHAP) and Local Interpretable Model-agnostic Explanations (LIME) were used to analyze the interpretability of the optimal model. Results: The XGBoost model predicted the best performance among the 9 models. Its AUC value reached 0.908 and the clinical net benefit is the highest. The Delong test showed that there was a significant difference between the ROC curves of XGBoost and the other models (PConclusions: Machine learning models are an effectively tool for predict the risk of depression. The use of SHapley Additive exPlanations and Local Interpretable Model-agnostic Explanations can maximize the clinical advantages of machine learning, which is helpful to predict or detect patients at high risk of depression as early as possible, and to take comprehensive evaluation and early prevention and treatment of depression.
},
 year = {2025}
}
TY  - JOUR
T1  - Construction of Depression Prediction Model Based on Machine Learning and Its Interpretability

AU  - Juan Wang
AU  - Man Cui
AU  - Miao Deng
AU  - Yanshuai Fan
AU  - Zhiguang Ping
Y1  - 2025/04/14
PY  - 2025
N1  - https://doi.org/10.11648/j.sd.20251302.12
DO  - 10.11648/j.sd.20251302.12
T2  - Science Discovery
JF  - Science Discovery
JO  - Science Discovery
SP  - 25
EP  - 32
PB  - Science Publishing Group
SN  - 2331-0650
UR  - https://doi.org/10.11648/j.sd.20251302.12
AB  - Objectives: The aim of this study was to construct depression prediction models based on machine learning algorithms, compared the performance of different machine learning models on depression risk prediction, and interpreted the model. Methods: A total of 2573 participants from the CHARLS database. LASSO and stepwise regression were used to screen for variables. The dataset is randomly divided into training set, validation set and test set according to 6:2:2. SMOTE resampling was used to balance the training set when fitted the model. Nine machine learning algorithms were used to construct the prediction model, inclpuding Decision Tree (DT), Random Forest (RF), Extreme Gradient Boosting (XGBoost), Light Gradient Boosting Machine (LightGBM), Elastic Network Regression (Enet), Support Vector Machine (SVM), Logistic Regression, Multilayer Perceptron (MLP), and K-Nearest Neighbor (KNN). The prediction ability of each machine learning classifier was evaluated on the test set according to the evaluation index, and the "optimal" model of this study was selected. Subsequently, SHapley Additive exPlanations (SHAP) and Local Interpretable Model-agnostic Explanations (LIME) were used to analyze the interpretability of the optimal model. Results: The XGBoost model predicted the best performance among the 9 models. Its AUC value reached 0.908 and the clinical net benefit is the highest. The Delong test showed that there was a significant difference between the ROC curves of XGBoost and the other models (PConclusions: Machine learning models are an effectively tool for predict the risk of depression. The use of SHapley Additive exPlanations and Local Interpretable Model-agnostic Explanations can maximize the clinical advantages of machine learning, which is helpful to predict or detect patients at high risk of depression as early as possible, and to take comprehensive evaluation and early prevention and treatment of depression.

VL  - 13
IS  - 2
ER  -
College of Public Health, Zhengzhou University, Zhengzhou, China
College of Public Health, Zhengzhou University, Zhengzhou, China
College of Public Health, Zhengzhou University, Zhengzhou, China
College of Public Health, Zhengzhou University, Zhengzhou, China
College of Public Health, Zhengzhou University, Zhengzhou, China